 Leash
Governance-as-code for Datadog
Keep your Datadog org on a leash.
Define policies in YAML. Leash scans your monitors, SLOs, dashboards, synthetics, and more — and reports or remediates anything that drifts out of line.
docker pull ghcr.io/mbaitelman/leash:latest
policies:
  - name: prod-monitors-must-have-team-tag
    description: Every production monitor
      needs an owning team.
    resource: datadog.monitor
    filters:
      - type: tag
        key: env
        value: prod
        op: present
      - type: tag
        key: team
        op: absent
    actions:
      - type: report
      - type: notify
        channel: slack
How it works
Write it down. Run it. Leash takes it from there.
A policy names a resource type, filters that select matching resources, and actions to take on each match. Everything else — pagination, auth, retries — is Leash's problem.
Write a policy
Declare what "good" looks like in plain YAML. Validate it in CI without touching the Datadog API.
$ leash validate --policy ./policies/
✓ 5 policies OKDry-run it
Leash queries the Datadog API and applies your filters. The first run is a dry run — see every match and what would happen, with zero changes.
$ leash run --policy ./policies/
3 matches · dry run · 0 mutationsTurn on enforcement
Happy with the matches? Drop the dry run and your policy's actions take over — Slack notifications, tags, remediation. No glue scripts required.
$ leash run --policy ./policies/ \
    --dry-run=false
✓ notified slack · ✓ tagged 3 monitors
The policy language
Small vocabulary, sharp expressions.
Filters are AND-ed by default and composable with boolean logic. Actions run in order on every match. Browse the example policies →
Value filters
Compare any field with dot-notation — creator.email, options.thresholds.critical — using 14 operators from eq to regex to in.
Tag & age filters
First-class helpers for Datadog tag arrays (present, absent, eq) and time-based rules like modified older-than 90d.
Boolean logic
Nest and, or, and not meta-filters to express exactly the population you care about.
Report & notify
Print matches as structured findings, or POST them to Slack — per-policy webhooks with an env-var fallback.
Tag & remediate
Stamp violations with tags like compliance:violation — and auto-remove them once a resource passes again with remove_on_pass.
Guarded deletes
Destructive actions need two explicit opt-ins: confirm: true in the YAML and --dry-run=false on the CLI.
Coverage
Seven resource types, one grammar.
Every resource exposes its fields to the same filters — and adding a new type is one self-registering Go file, with no engine or CLI changes.
datadog.monitorMetric, log, APM, and composite monitorsdatadog.sloService Level Objectivesdatadog.syntheticSynthetic API and browser testsdatadog.dashboardDashboardsdatadog.userUser and service accountsdatadog.rum_applicationRUM applicationsdatadog.rum_retention_filterRUM retention filters, per appdatadog.*Yours next — see Extending LeashSafety model
Loud about findings, careful about changes.
-
Every run is a dry run by defaultMutating actions are logged, not executed, until you pass
--dry-run=false. -
Validate without credentials
leash validateparses and checks policies offline — perfect as a CI gate on policy PRs. -
Schema for your editor
leash schemaemits a JSON Schema so policy YAML gets completion and validation as you type. -
Auditable outputFindings reports record every action taken — resource, action type, dry-run flag, success.
{
  "run_id": "a3f2c1d4-…",
  "dry_run": true,
  "policies": [{
    "policy_name": "prod-monitors-must-have-team-tag",
    "resource": "datadog.monitor",
    "match_count": 3,
    "matches": [{
      "id": "12345678",
      "properties": { "name": "High error rate", … }
    }],
    "actions_taken": [{
      "action_type": "report",
      "dry_run": true,
      "success": true
    }]
  }]
}
Web UI
A control room, when you want one.
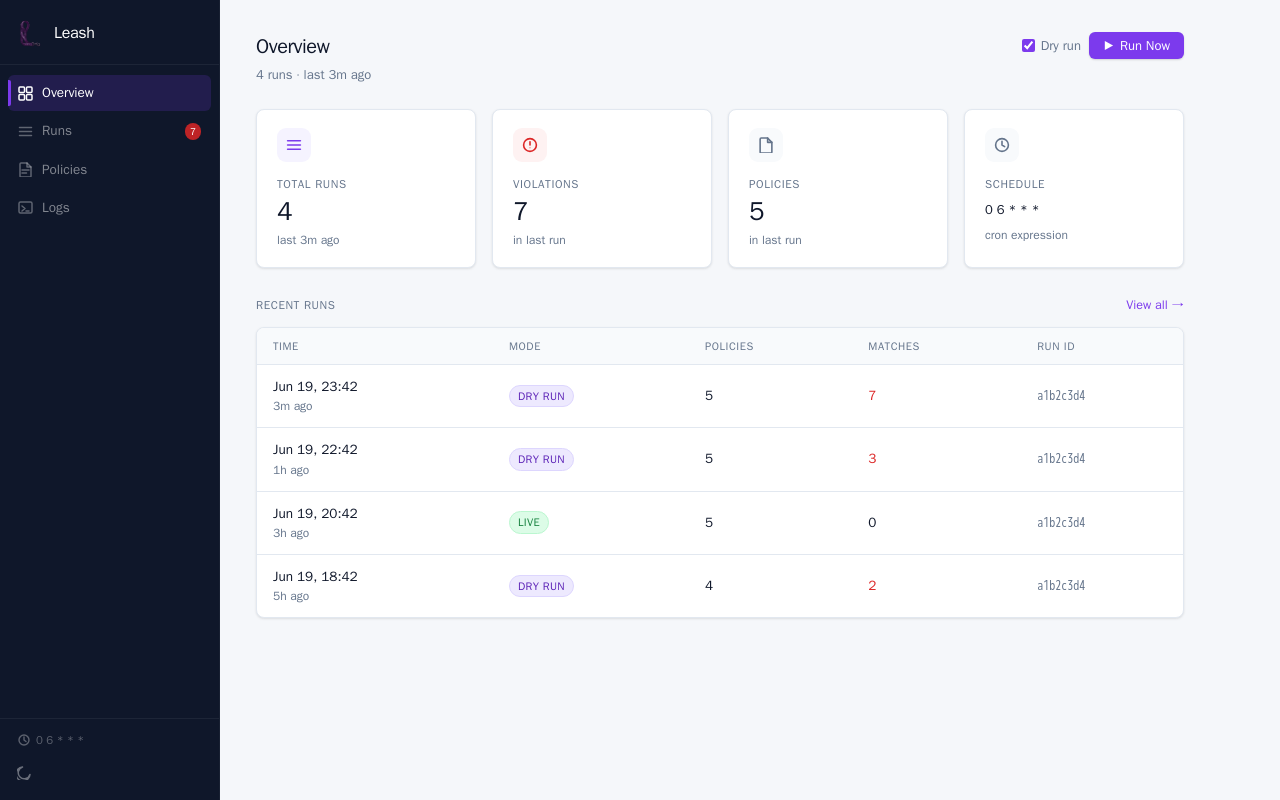
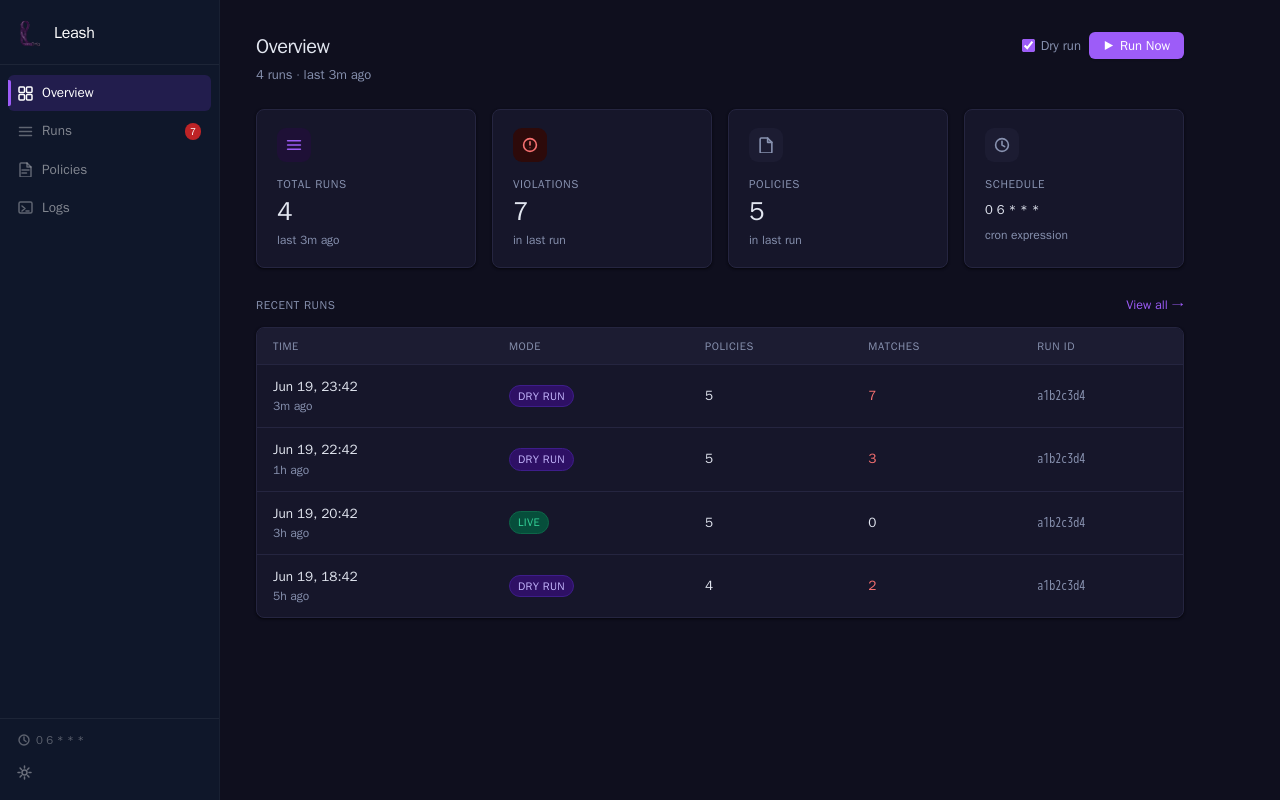
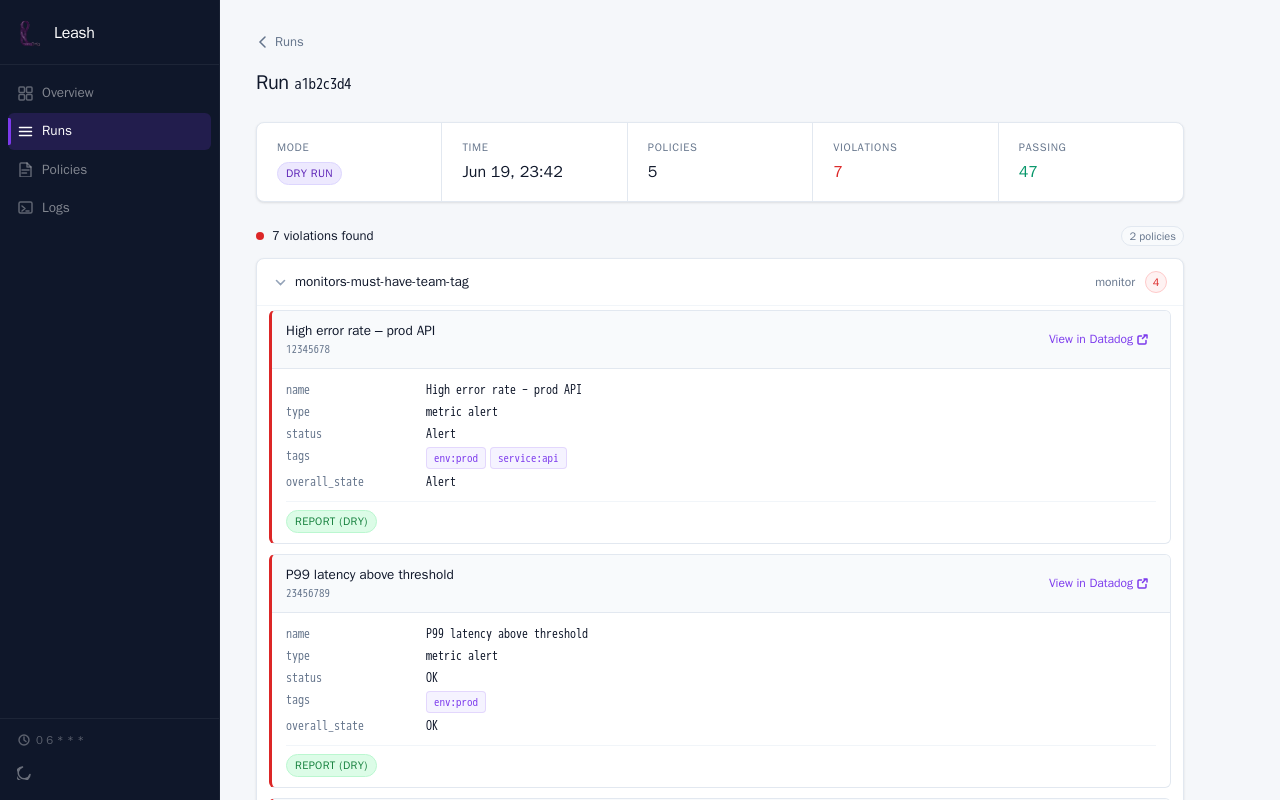
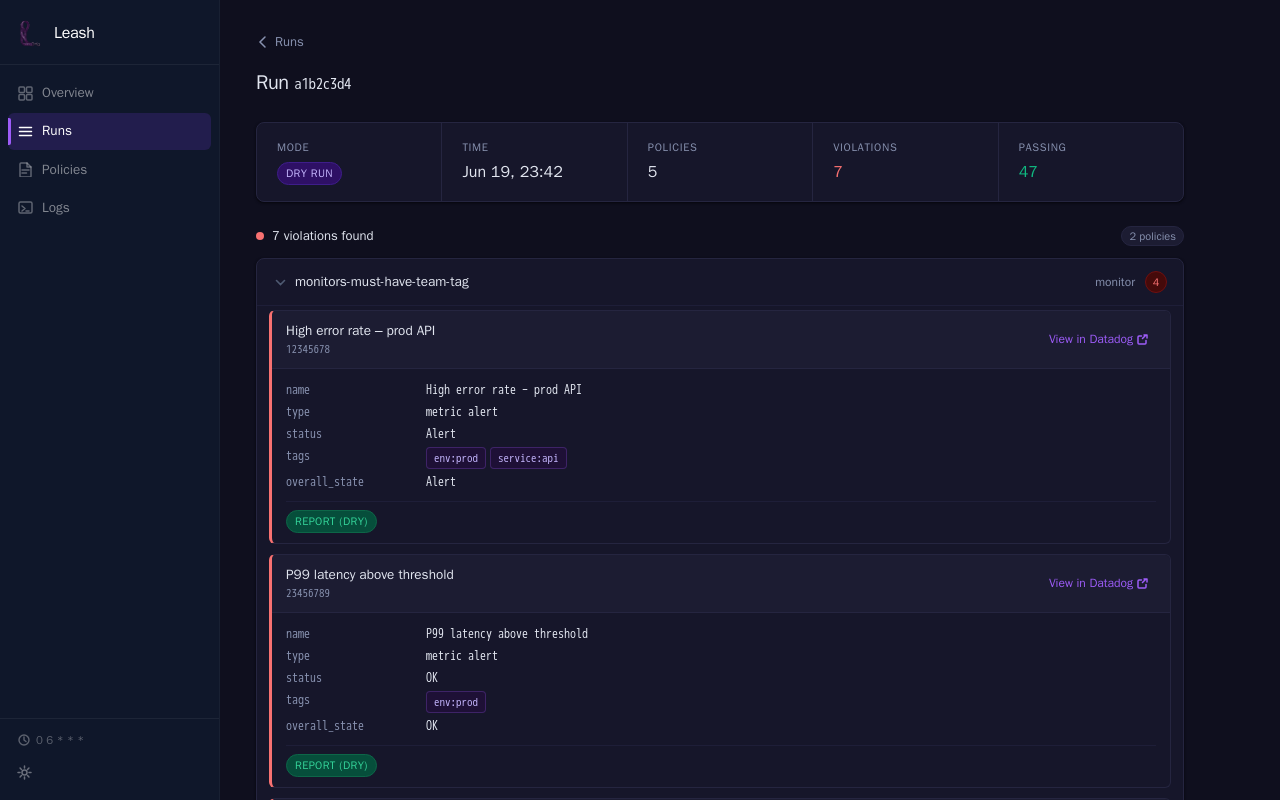
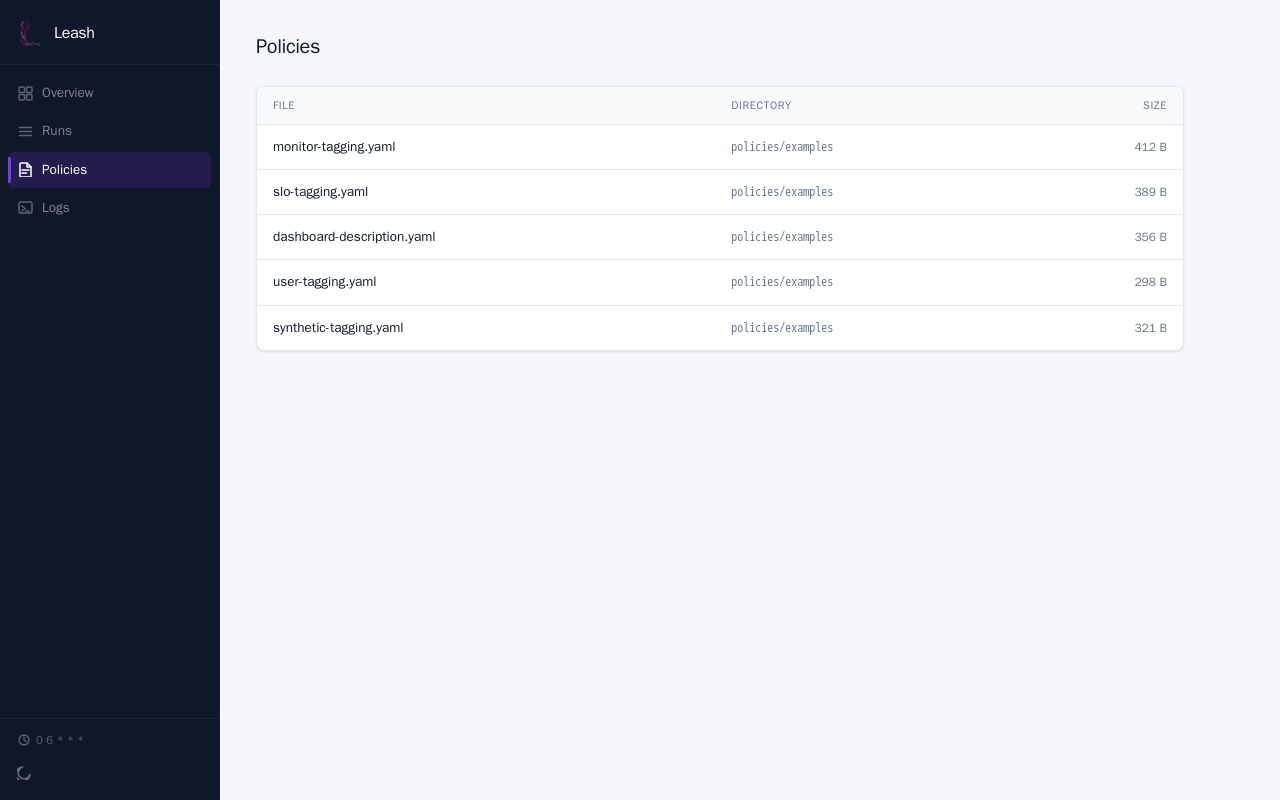
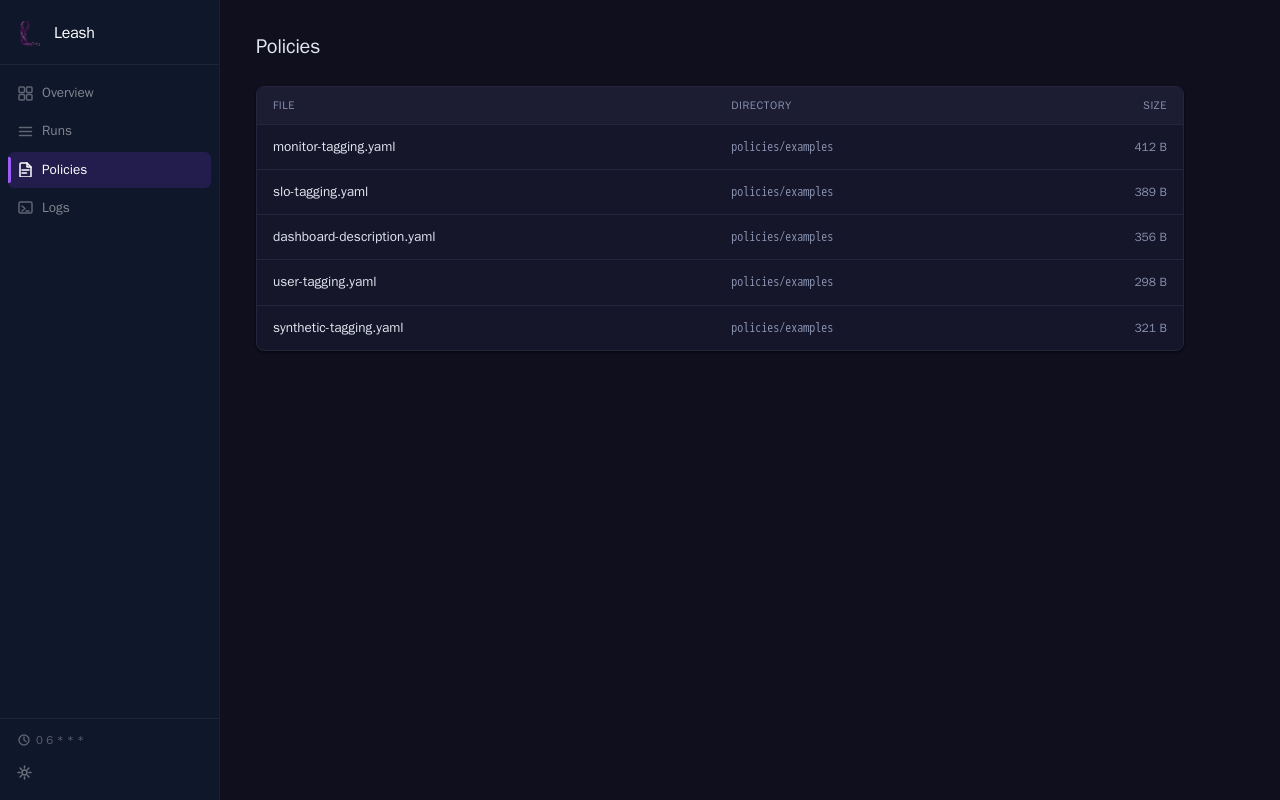
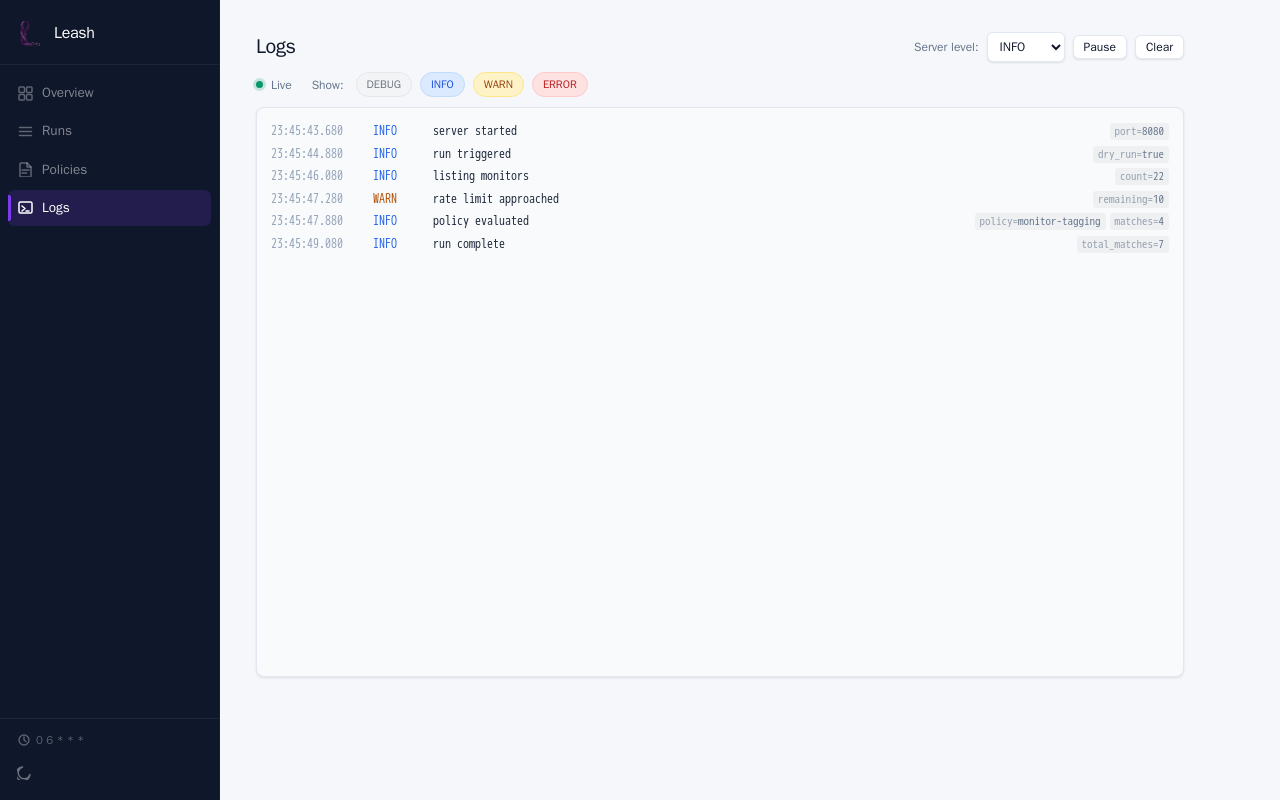
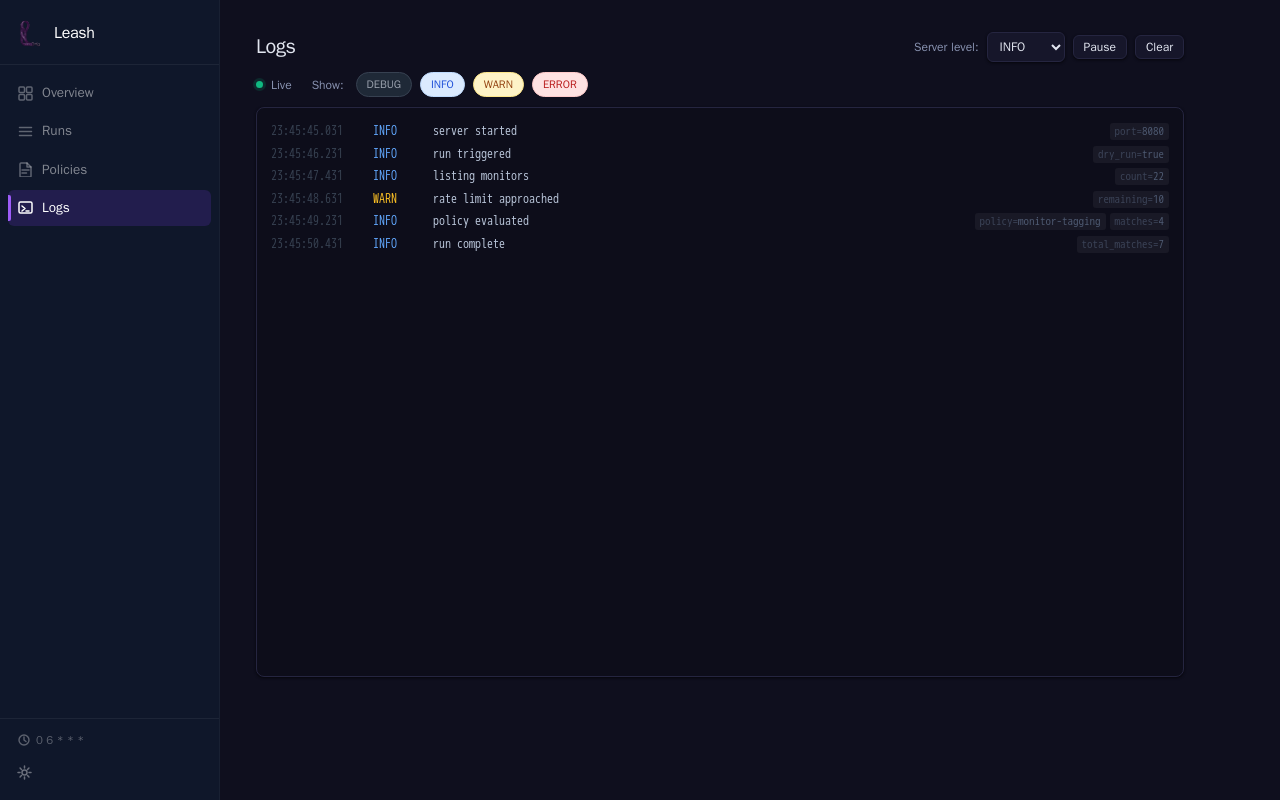
leash serve starts a local web UI for running policies, browsing results, and editing policy files — with live log streaming, cron-scheduled runs, and dark mode. The screenshots below follow this page's theme.
Quick start
Two commands to your first findings.
Set DD_API_KEY and DD_APP_KEY in your environment, point Leash at a policies directory, and run. Key setup guide →
Docker recommended
# Validate policies
$ docker run --rm --env-file .env \
    -v $(pwd)/policies:/policies:ro \
    ghcr.io/mbaitelman/leash:latest \
    validate --policy /policies/

# Scan (dry run is the default)
$ docker run --rm --env-file .env \
    -v $(pwd)/policies:/policies:ro \
    ghcr.io/mbaitelman/leash:latest \
    run --policy /policies/
From source
# Requires Go 1.26+
$ git clone https://github.com/mbaitelman/leash
$ cd leash
$ go build -o leash ./cmd/leash

# Scan your org
$ ./leash run --policy ./policies/

# Or open the web UI
$ ./leash serve --host 127.0.0.1
Ready to remediate? Re-run with --dry-run=false once the findings look right.